 Ajax Editor
Ajax development
Monitoring Using Microsoft Operations Manager and SQL Server Management PackMicrosoft Operations Manager (MOM) provides a way to manage multiple solutions in your enterprise environment, not just SQL Server (see Figure 9-18). Management Pack is a plug-in to the Microsoft Operations Manager whose purpose is to monitor SQL Server specifically. MOM monitoring is architected so there is a central MOM server and multiple MOM Agents reporting to it. Actual monitoring is performed by a MOM agent. One agent per computer is sufficient, and the agent can monitor multiple instances of SQL Server Database Engine at the same time. Figure 9-18. MOM architectural diagram.
The MOM Agent does not depend on the state of the components it is monitoring, so it detects failure of SQL Server and reports its state back to the central console. If for some reason the MOM Agent itself or the computer on which it's running is down, the Central MOM Server generates an alert because it fails to receive a successful heartbeat from its agent. The MOM user interface consists of two main applications. The Administrator Console is used to perform MOM configuration when you need to customize the management pack. The Operator Console is used to actually do the monitoring. Administrator ConsoleTo start monitoring, you have to install MOM on a central machine, import SQL Server Management Pack, and then assign SQL Servers to it. Let's examine these steps. First you need to launch the MOM 2005 Administrator Console and import SQL Server Management pack by clicking on the Import/Export Management Packs link and following the Management Pack Import/Export Wizard steps as depicted in Figure 9-19. Figure 9-19. Microsoft Management ConsoleAdministrator Console.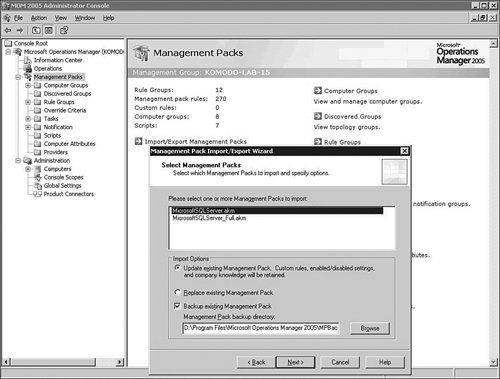
Note that installing SQL Server Management Pack requires a separate download from Microsoft because it is not shipped in the same box as SQL Server 2005 itself. MOM uses multiple rules to determine what data to collect, how frequently to collect it, and how to analyze it. SQL Server Management Pack comes pre-configured with default rules and configuration settings, so immediately after installation it can be used for direct monitoring of assigned SQL Server instances. It does not require extra configuration effort right away and can wait until you feel the need to modify some of the existing rules or add new ones. Another important point is that SQL Server Management Pack, shipped with SQL Server 2005, also includes monitoring capabilities for SQL Server 2000, so you don't need to look for it separately. How do you actually begin monitoring a SQL Server instance? After importing SQL Server Management Pack, you need to deploy the MOM Agent on the computer you want to monitor. You can do it directly from the MOM Administrator Console by first checking all monitored computers and then following the pop-up menu as shown in Figure 9-20. Figure 9-20. Installing the MOM Agent.
This launches the Install/Uninstall Agents Wizard (see Figure 9-21). Follow the wizard steps until you get to the final screen (Completing the Install/Uninstall Agents Wizards), describing the series of actions about to occur. Figure 9-21. Install/Uninstall Agents Wizard.
After you select Finish, the MOM Agent is going to be deployed on the target machine and start monitoring as prescribed by the configuration rules. Rule GroupsWhat are some of the most important rule groups of SQL Server 2005? The Client Side Monitoring group (see Figure 9-22) is used to monitor connectivity to the monitored SQL Server Database Engine instance. It also catches possible network latency problems. Figure 9-22. Microsoft Management PackClient-Side Monitoring.
Client Side Monitoring rules have default values, but to actually start monitoring you will have to do a little configuration work. First, you need to decide what remote computer will be performing connectivity checks. That computer needs to be added to the appropriate computer group, as shown in Figure 9-23. Figure 9-23. Client-Side Monitoring computer group.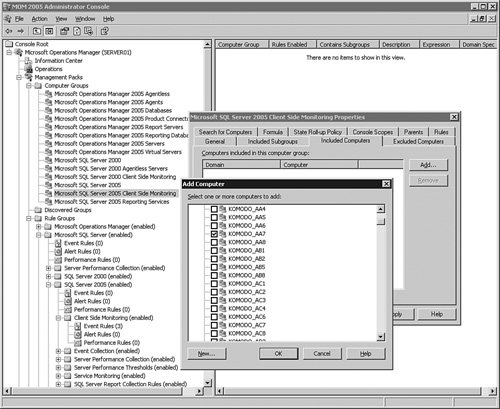
Next you need to decide what instances of SQL Server Database Engine the computer is going to monitor. That setting is located under the rules group. Let's bring up the Event Rule Properties dialog by doubleclicking on the SQL Server Remote Connectivity event. Inside the dialog, switch to the Responses tab. Highlight the pre-configured script and click Edit. The resulting Launch a Script dialog is shown in Figure 9-24. Figure 9-24. Client-Side Monitoring customizations.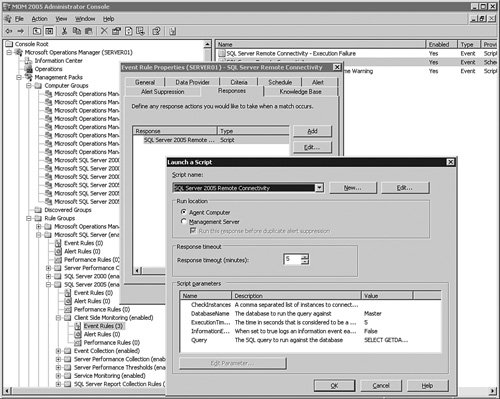
From within the Launch a Script dialog you can change several essential monitoring characteristics. Suppose you have strict performance requirements on a specific query used by the application. You may want to consider using this specific query directly for monitoring. You can do this by double-clicking the Query property inside the grid. After you modify the query, you may need to adjust expected execution time and database through the ExecutionTime and DatabaseName properties. Now you are ready to assign monitored SQL Server Database Engine instances to this MOM Agent by modifying the CheckInstances property and providing a comma-separated list of instance names. Only after the instance name list is populated will the MOM Agent start client-side monitoring. The Event Collection group combines more that 200 various SQL Server-specific events that can be collected by the MOM Agent. Tips and Tricks SQL Server Database Engine event collections are based on readings of the Windows Application Event Log. This event collection process is conducted in a fashion similar to how SQL Server Agent collects them. This means the same technique described earlier (in the section SQL Server Event Alerts) for selecting the correct event still applies. Creating a new event collection rule is very simple. Right-click the event rule tree node under the desired group or subgroup folder (see Figure 9-25), and step through a simple wizard, describing the required event criteria. Figure 9-25. MOM Create Event Rule.
The Performance Monitoring group covers a collection of performance counters affecting SQL Server Database Engine internal performance characteristics, such as lock timeouts/sec and average wait times in milliseconds. It also includes resource monitoring, such as CPU performance and disk and memory usages. This grouping makes sense because computer resources directly affect application performance. The Service Monitoring group checks on the state of different services. In addition to SQL Server Database Engine itself, MOM Management Pack monitors SQL Service Broker, SQL Browser Service, Notification Services, and other services. The State Monitoring and Service Discovery group monitors the overall health of the SQL Server Database Engine. One of the most important aspects of this group is space monitoring. Let's bring up the pre-configured settings for monitoring database space usage and see whether modifications are necessary. You can do this by double-clicking the SQL Server Database Space Analysis event, as shown in Figure 9-26. Figure 9-26. MOM State Monitoringspace analysis configuration.
Now bring up the Responses tab and edit the pre-configured response. As you can see from Figure 9-26, in the current configuration a warning will be generated if available database space drops below 20%. If available space is below 10%, an error is generated. You may want to modify these configuration values to fit your particular space usage patterns and requirements. Tips and Tricks If you want any configuration changes made to the MOM Management Pack to take effect immediately, you need to follow a special procedure shown in Figure 9-27. Choose Commit Configuration Change. This causes the MOM Server to broadcast all changes to the entire network of MOM Agents right away. Figure 9-27. MOM committing configuration changes.
Note If you don't force the configuration to be committed, changes will be picked up, but after a built-in delay of several hours. Operator ConsoleOperator Console is split into different views (see Figure 9-28). The Alerts view is the most important one, and covers all current alerts on all the systems aggregated together. You can also see specific alert details in the bottom pane of the screen. Figure 9-28. MOM Operator ConsoleAlerts view.
The State view (see Figure 9-29) shows the state of your monitored computer and different components, including the MOM Agent, MOM Server, and SQL Server. Figure 9-29. MOM Operator ConsoleState view.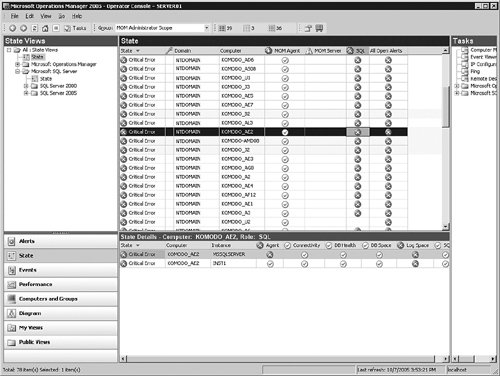
As you may notice in Figure 9-30, placing the cursor on a specific row in the grid enables you to see the details of this alert and drill down by double-clicking on the alert. Figure 9-30. MOM Operator ConsoleAlert drill-down.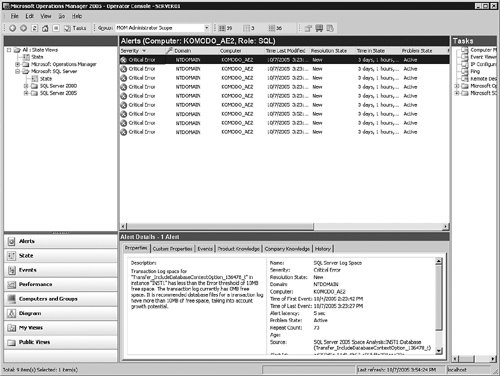
Now you can see a full history of the specific alert with an explanation of what could be causing it. |
 Ajax Editor
Ajax development