 Ajax Editor
Ajax development
Monitoring Server ActivityThis section concentrates on SQL Server Management Studio Activity Monitor and provides examples of some typical problems that can be solved using the tool. Activity MonitorActivity Monitor is a SQL Server Management Studio component that displays information about client applications and processes that are currently running on an instance of Database Engine. In addition, Activity Monitor provides the functionality to view the T-SQL statements each process last executed and any locks the statement is holding. Activity Monitor also allows a system administrator to view blocked processes and optionally terminate or "kill" the blocking process (or any problematic process). To start Activity Monitor for an instance of Database Engine, launch SQL Server Management Studio, connect Object Explorer to the instance of Database Engine, expand the Management node, right-click on Activity Monitor and select View Processes (see Figure 9-1). You can select View Locks by Process and View Locks by Object if you want to launch Activity Monitor for the purposes of monitoring locks, but all three menu options launch Activity Monitor in the context of one of its three pages. Figure 9-1. Activity Monitor is launched from Object Explorer in SQL Server Management Studio.
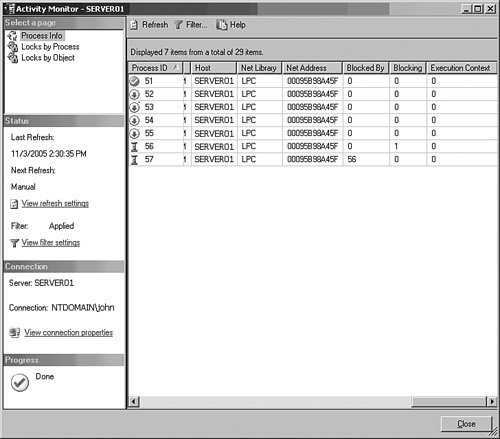
Activity Monitor has three pages for displaying processes and lock information on the server. The first page is called Process Info (see Figure 9-2), and it displays information about processes such as process ID or SPID, status of the process, the blocking process, username, application name, host name, network protocol, login time, last batch executed time, CPU, and memory usages. The Locks by Process page displays locks grouped by connection. The Locks by Object page displays locks by the object name. Figure 9-2. Activity Monitor provides information about user connections on a server.
New in SQL Server 2005, Activity Monitor provides auto-refresh functionality, which allows the user to specify an interval of time after which to automatically fetch and display server activity information. To specify the refresh settings, click on View refresh settings on the left side of the Activity Monitor dialog. This will launch the Refresh Settings dialog (see Figure 9-3) where you can enable or disable the auto-refresh option. Enabling the auto-refresh option allows you to specify the amount of time for the auto-refresh interval. Be aware that specifying a low auto-refresh interval may not be a good idea. Activity Monitor runs specific queries on the server, which could hinder system performance, depending on the load and size of your system. Figure 9-3. The Refresh Settings Dialog box.
The additional new functionality in the Refresh Settings Dialog is the capability to specify filtering criteria for information displayed in Activity Monitor (see Figure 9-4). The filtering is particularly useful when there are tens or hundreds of connections on the server and the system administrator must monitor activity for a particular database, application, username, blocked processes, or other system phenomenon. Figure 9-4. Information in Activity Monitor can be filtered to target a specific scenario.
SQL Server Management Studio also provides the capability to run multiple Activity Monitor dialogs simultaneously. This allows the system administrator to designate a specific monitoring task in each Activity Monitor dialog. For example, a DBA may decide to launch three Activity Monitor dialogs and set the filtering settings such that the first dialog monitors activity on a specific database, the second dialog monitors blocked processes, and the third dialog monitors activity from a specific application or user. Monitoring ScenariosAlthough system stored procedures such as sp_who or sp_who2 have traditionally provided server activity information, these stored procedures do not provide the same versatility as a graphical tool such as Activity Monitor. Activity Monitor provides monitoring of blocking and lock information in the same interface, with options such as filtering and auto-refresh. It also enables you to view the T-SQL statements for each of the processes and the option of killing a process, which makes it a handy tool for monitoring processes on a server. Identifying Blocked Processes on a ServerUsing Activity Monitor, you can quickly view the status of processes and identify blocked processes on a server. To identify a process and determine whether or not it is blocked, launch Activity Monitor. Click on the Process Info page to view all processes currently running on the server. To identify blocked processes in the Activity Monitor grid, look for processes with a status of suspended, scroll to the left and look for a non-zero value in the Blocked By field. Figure 9-5 depicts an example where process 57 is blocked by process 56. Figure 9-5. Activity Monitor can be used to identify blocked processes.
Alternatively, you can use the suspended icon next to the ProcessID field to identify the suspended processes. The icons for process status are described in Table 9-1. Filtering Blocked Processes in Activity MonitorIn the previous scenario, Status and Blocked By fields were used to visually identify blocked processes, but what if there are hundreds or thousands of connections to the server? The answer is to use the filtering functionality of Activity Monitor. In the Filter Settings dialog, change the Blocking Type to Blocked (see Figure 9-6) to view only those processes that are blocked by other processes. You can use other values in Blocking Type to view just blocking and/or blocked processes in Activity Monitor. Figure 9-6. Activity Monitor Filter Settings.
As mentioned before, filtering in Activity Monitor enables additional scenarios where you can set filtering criteria to view activities in a particular database, application, user, and so on. Identify Last Executed Command from a ConnectionIn addition to describing processes and locking information, Activity Monitor provides the functionally to view the last executed command for each process on the server. To view the last Transact-SQL batch executed by a connection, identify the process related to the connection in the Activity Monitor, right-click, and select Details, (see Figure 9-7). Figure 9-7. Activity Monitor provides the functionality to view the last executed command by each process.
In the Process Details dialog, you can view or select and copy the last executed T-SQL batch as shown in Figure 9-8. Although the dialog launches in a small window, you can easily resize or maximize it to view long T-SQL batches. There is refresh functionality on this dialog to view subsequent T-SQL batches that were issued by the same process. Also, you can use Kill Process directly from this dialog. Figure 9-8. The last Transact-SQL command batch executed by process 56.
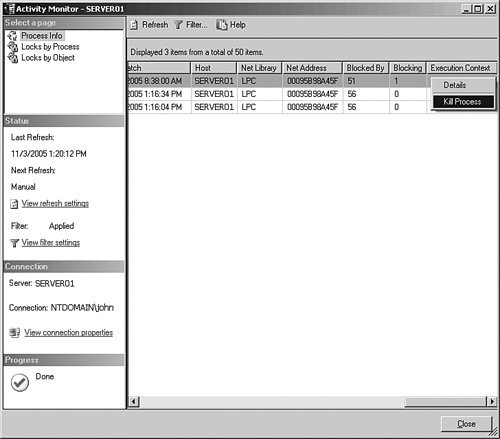
Terminating or Killing a User ConnectionIn some scenarios the system administrator must terminate a user connection from the server. A common scenario is when one process blocks another process, which in turn blocks another process, and the chain of blocking continues. Although resolving the locking and blocking requires a thorough investigation, the best temporary solution for the DBA is to ask end-users to cancel operations from their applications. However, in some cases cancellation is not possible, or the end-users are not available. In these situations, the best solution would be to terminate or kill the process at the head of the blocking chain. To kill a process from Activity Monitor, identify the process in the Activity Monitor grid, right-click, and select Kill Process (see Figure 9-9). Figure 9-9. Activity Monitor provides the functionality to kill a process.
|
 Ajax Editor
Ajax development