 Ajax Editor
Ajax development
Using SQL Server Management Studio for Query OptimizationThe simplest way to tune performance of a single query is by using Query Editor (part of SQL Server Management Studio) and turning on one of the two execution plan options available under the Query menu item. Display Estimated Execution Plan for a query does not actually execute any T-SQL statements in your batch; it captures a query execution plan in XML format associated with each of your statements and produces a graphical representation in the bottom pane of the window (shown in Figure 7-1). Figure 7-1. Display Estimated Execution Plan query results.
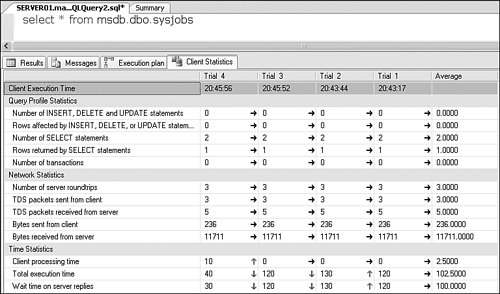
Note SQL Server releases prior to 2005 do not use XML format for describing execution plans. Display Estimated Execution Plan is accomplished when you use the SET SHOWPLAN_XML ON command. The SQL Server Database Engine parses any T-SQL submitted following the aforementioned command. The server produces well formed XML describing the estimated execution plan as if the statement actually ran and sends it to the client as a regular resultset. Include Actual Execution Plan waits for you to actually run the queries on the server, then displays the results and also includes the execution plans. Query Editor achieves this by executing SET STATISTICS XML ON before running the batch. Tips and Tricks It is also possible to extract execution plan information and automatically save it to a file by using SQL Server Profiler. This technique will be described further later in this chapter. Another interesting option exposed by Query Editor is Include Client Statistics. This option utilizes SQL Server Managed Data Provider and does not impose any additional processing workload on Database Engine. Results of selecting this option are shown in Figure 7-2. Figure 7-2. Include Client Statistics output.
Note how with each query run the statistics results get updated with new processing times, including change of direction for each value. Tips and Tricks Note how the client statistics in Figure 7-2 indicate that there were two select statements in the batch when in reality there was only one. They do so because the previously selected Include Actual Execution Plan option was not turned off. You have to be careful to look at only pure values when comparing different runs and filter out other activity generated by the graphical tool. Two separate tuning and optimization tools are located in the Performance folder: SQL Server Profiler and Database Engine Tuning Advisor. The following section takes a detailed look at each of them. |
 Ajax Editor
Ajax development