Calculators >>>
Enter a parabolic equation, like 5x^2 + 18x + 27 and this Parabola calculator will determine all the vital information about the graph. And, a rough graph of the curve is available.
Step 1: Add the below code to the <body> section of your page:
<script
language= "javascript"
type= "text/javascript" > var
a ,
b ,
c ; function
xtop ( form )
{ form . u . value
=
( form . b . value
*
- 1 )
/
( form . a . value
*
2 ); function
ytop ( form )
{ form . u2 . value
=
- 1
*
( form . b . value
*
form . b . value )
/
( 4
*
form . a . value )
-
(- 1
*
form . c . value ); function
doCoord ( form )
{ form . co . value
=
form . u . value
+
","
+
form . u2 . value ; function
disc ( form )
{ form . o . value
=
( form . b . value
*
form . b . value )
-
( form . a . value
*
form . c . value
*
4 ); function
zeroes1 ( form )
{ form . n . value
=
(( form . b . value
*
- 1 )
-
( Math . sqrt ( form . o . value )))
/
( form . a . value
*
2 ); function
zeroes2 ( form )
{ form . n2 . value
=
(( form . b . value
*
- 1 )
-
(- 1
*
Math . sqrt ( form . o . value )))
/
( form . a . value
*
2 ); function
move_in ( img_name , img_src )
{ document [ img_name ]. src = img_src ; </script> <form> <table
bgcolor= "#C0C0C0"
cellspacing= 2
cellpadding= 2
border= 3 > < b > h3 > Parabolic
Calculator < /h3 > <input
name= "a"
size= "3" > X < sup > 2 < /sup > + <input
name= "b"
size= "3" > X
+ <input
name= "c"
size= "3" > < br > <input
type= "button"
value= "x-top"
name= "x-top"
onclick = "xtop(this.form)" >
type= "button"
value= "y-top"
name= "y-top"
onclick = "ytop(this.form)" >
type= "button"
value= "crd"
name= "crd"
onclick = "doCoord(this.form)" >
type= "button"
value= "disc."
name= "D"
onclick = "disc(this.form)" > < br > <input
type= "button"
value= "0-points"
name= "zeroes"
onclick = "zeroes1(this.form);zeroes2(this.form)" >
type= "button"
onclick = "xtop(this.form);ytop(this.form);doCoord(this.form);disc(this.form);zeroes1(this.form);zeroes2(this.form)"
value= "do
all" >
type= "button"
name= "pics"
value= "show
e.g."
onClick = "if(form.a.value>0
&& form.o.value>0)move_in('p','p2.gif');if (form.a.value<0 &&
form.o.value>0)move_in('p','p3.gif'); if(form.a.value>0 &&
form.o.value==0) move_in('p','p4.gif'); if(form.a.value<0 &&
form.o.value==0) move_in('p','p5.gif'); if(form.a.value>0 &&
form.o.value<0) move_in('p','p6.gif'); if(form.a.value<0 &&
form.o.value<0) move_in('p','p7.gif')"
value= "show
e.g." > < br > <input
type= "text"
name= "u"
size= "8" >
x-top < br > <input
type= "text"
name= "u2"
size= "8" >
y-top < br > <input
type= "text"
size= "8"
name= "co"
onmouseover = "form.rem.value=form.co.value" >
Coord. < br > <input
type= "text"
size= "8"
name= "o" >
Discriminant < br > <input
type= "text"
size= "8"
name= "n" >
neg zero pt. < br > <input
type= "text"
size= "8"
name= "n2" >
pos zero pt. <input
type= "hidden"
value= ""
name= "rem" > < br > <input
type= "reset"
value= "reset" > < br > /b > </td> <img
src= "p1.gif"
width= 200
name= "p"
height= 200
border= 0
alt= "" > </td> </form>
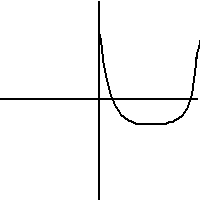
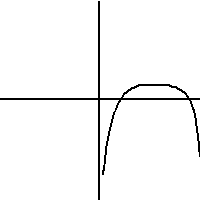
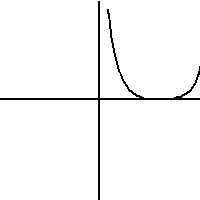
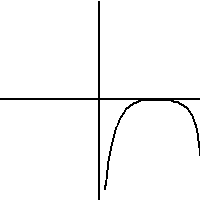
Step 2: The script uses 7 images as part of its interface. You can create your own, or use the 7 below (resized for easier download):

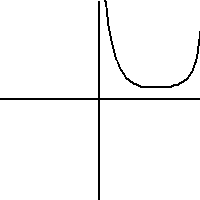
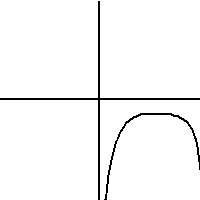 (right click images, and select "Save Image As")